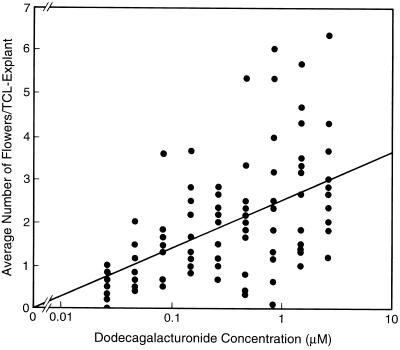
Figure 3.
Plot of the log of G12 concentration versus the average number of flowers induced per TCL explant. The data from 12 experiments are shown, and each data point represents the average number of flowers produced by the six replicate TCL explants used for each treatment in a given experiment. In the absence of G12, no flowers were formed. The line represents the dose-response curve for G12 as determined by least-squares analysis using log concentration.

