Fig. 1.

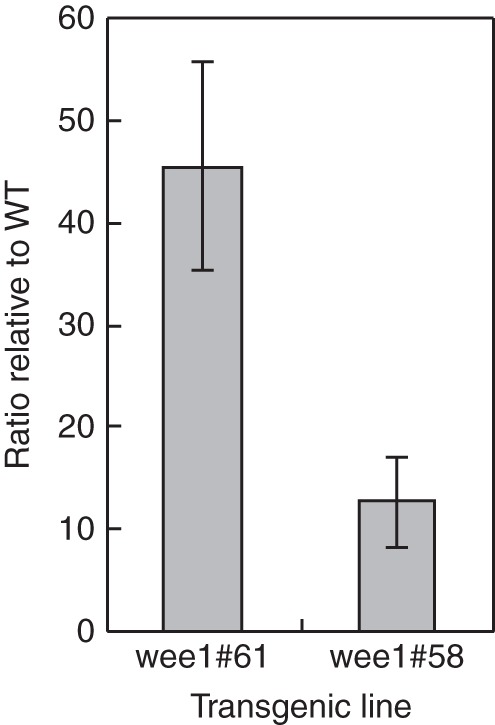
Molecular characterization of WEE1oe genotypes: semi-quantitative RT-PCR of Arath;WEE1 showing increased expression in the two transgenic lines (#58 and #61) compared with WT (mean ± s.e., n = 3).

Molecular characterization of WEE1oe genotypes: semi-quantitative RT-PCR of Arath;WEE1 showing increased expression in the two transgenic lines (#58 and #61) compared with WT (mean ± s.e., n = 3).