
Fig. 1.
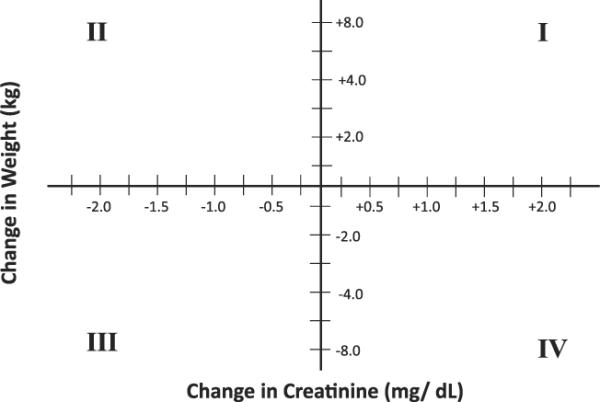
Two-dimensional grid for the primary end point of change in weight and change in creatinine 96 hours after enrollment. Each study subject's change in weight and change in creatinine will be plotted on the figure such that subjects in quadrant I will represent those with increased weight and increased creatinine and subjects in quadrant III will represent those with weight loss and a reduction in creatinine.