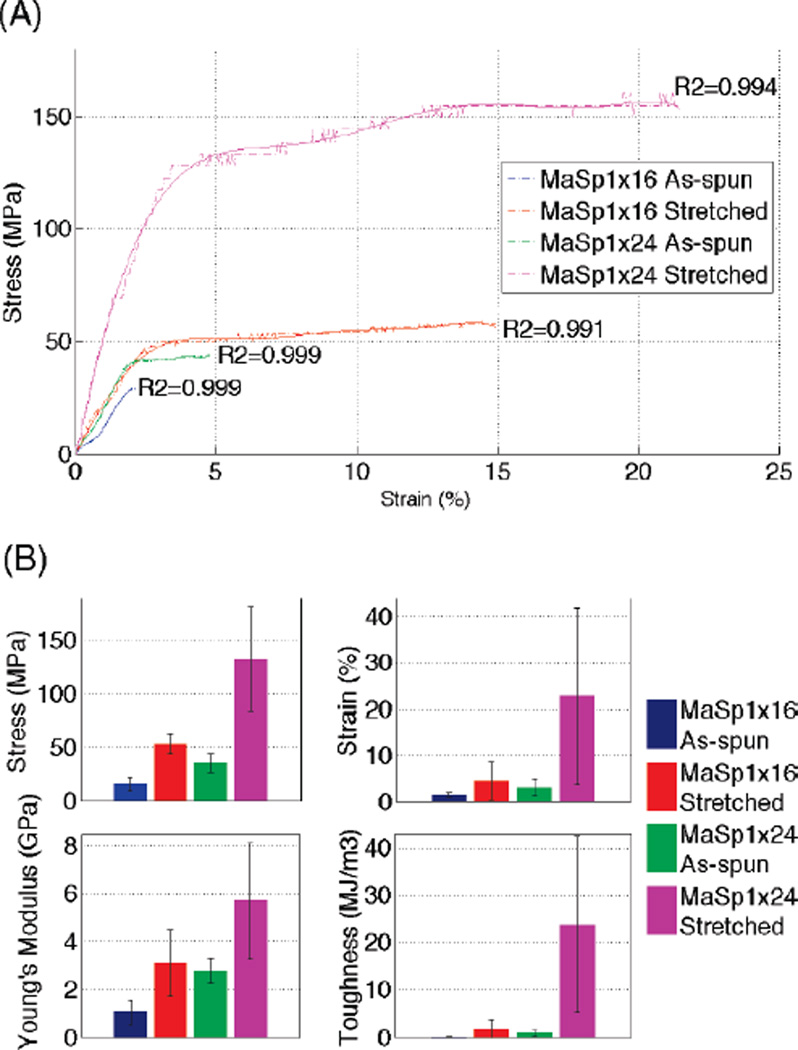
Figure 3.
Mechanical testing data analysis of synthetic silk fibers. (A) Typical stress–strain curves (dashed-dotted line) of (MaSp1)16 as-spun (blue), (MaSp1)16 stretched (red), (MaSp1)24 as-spun (green), (MaSp1)24 stretched (magenta) with trendlines (solid line with corresponding colors) fitted to an polynomial order of the seventh degree. (B) Column charts present the average performance in stress, strain, Young’s modulus, and toughness of all of the fibers tested in each group. All error bars represent standard deviation with n ≥ 10.

