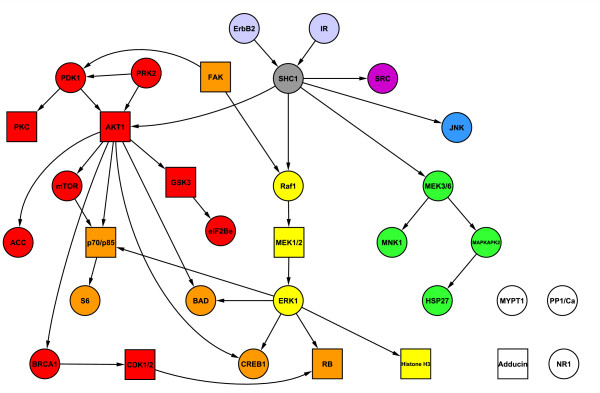
Figure 5.
Network and pathway structure for biologically informative priors in the cancer drug response data study. Network constructed using information from cellsignal.com. Square nodes represent fully connected subnetworks consisting of iso-forms and phospho-forms of the named protein (see Additional file 1). Node colouring represents pathway structure. Red, blue, yellow, green and purple nodes denote 5 pathways. Orange nodes are in both the red and yellow pathways. Light grey nodes are in all 5 pathways. Dark grey node is in all pathways except the purple pathway. White nodes are not assigned to a pathway.

