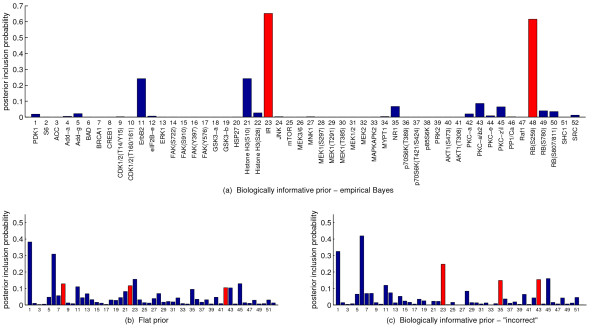
Figure 7.
Drug response data, posterior inclusion probabilities. Obtained via exact model averaging with (a) biologically informative pathway-based model prior with parameters set objectively using empirical Bayes (m = 2 (intra-pathway distance), λ = 5 - see Figure 6), (b) flat prior and (c) "incorrect" biologically informative prior that is not optimal according to empirical Bayes analysis (m = 1 (number of pathways), λ = −5). Posterior inclusion probabilities provide a measure of how influential each protein is in determining drug response. Proteins contained in the single MAP model are shaded red.

