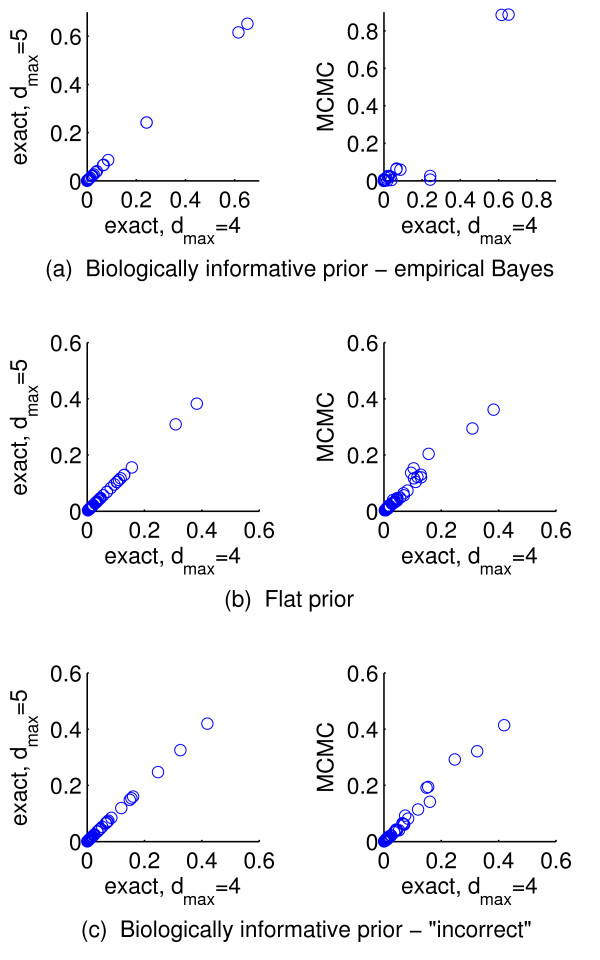
Figure 8.
Drug response data; effect of sparsity restriction. Posterior inclusion probabilities in Figure 7 were obtained by exact model averaging with the number of predictors included in a model restricted to not exceed dmax = 4. These results were compared with results obtained by exact model averaging with an increased maximum number of included predictors of dmax = 5 (left column) and using Markov chain Monte Carlo-based model averaging with no sparsity restriction (right column).

