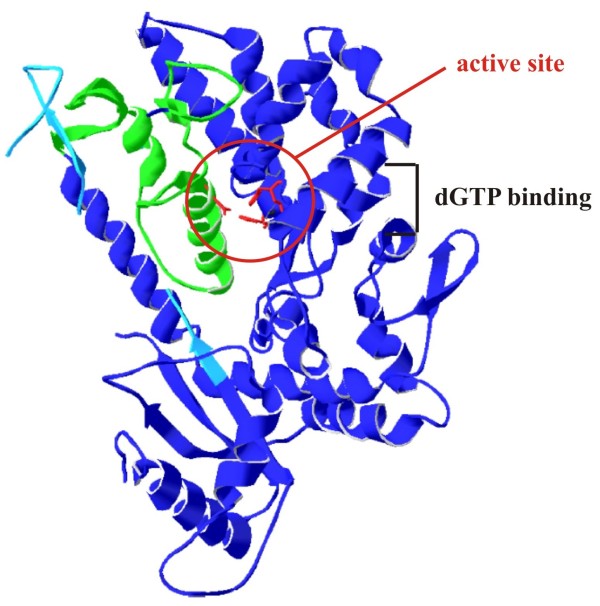
Figure 6.
Location of SAMHD1 exons 8–9 and exon 14 sequences on SAMHD1 structural model. A representation of the SAMHD1 crystal structure was generated using Swiss PDB viewer ( [32] and http://www.expasy.org/spdbv/) based on published coordinates from Goldstone et al. (PDB ID: 3U1N [19]). Active site residues His167, His206, Asp207 and Asp311 are shown in red and are highlighted by a red circle. The region encoded by exons 8 and 9 (residues 285–354) is shown in green. The region encoded by exon 14 (residues 502–536), for which only partial structural information is available, is shown in light blue. The dGTP binding region of SAMHD1 as determined by Goldstone et al.[19] is indicated as well

