
Figure 3.
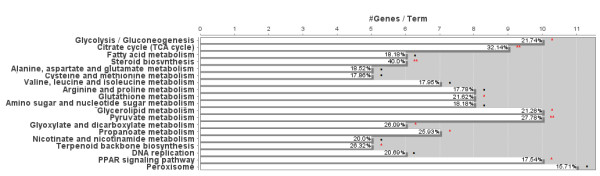
KEGG pathway analysis of genes differentially expressed in fasting vs. fed. Genes differentially expressed in fasting vs. fed were matched to KEGG pathway membership using ClueGO. The percentage and #genes/term indicates the percentage and number of the genes in the pathway that are contained in the set of genes altered by fasting. · p < 0.1 * p < 0.05 **, p < 0.01, based on Benjamini-corrected p-value.