
Figure 1.
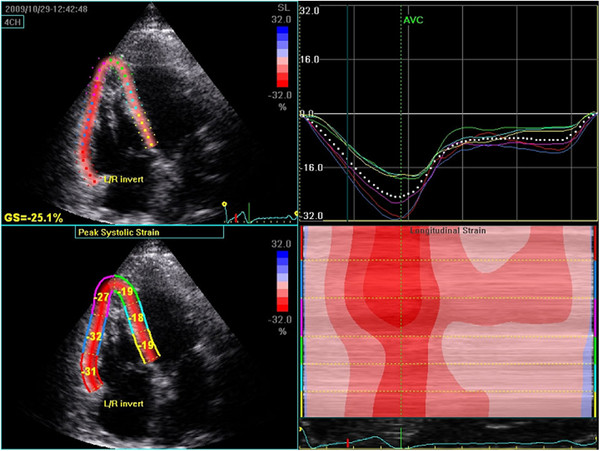
Determination of longitudinal strain in an apical four chamber view. Left side: Colour display of peak systolic strain. The right side shows average segmental strain graphically displayed (upper) and an M-mode representation of peak systolic strain (lower).