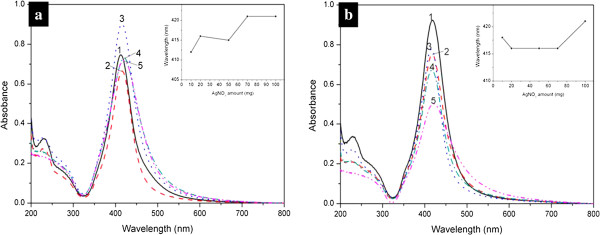
Figure 5.
UV-vis spectra of silver aqueous solutions obtained dry and wet systems. The (a) dry and (b) wet systems at 100°C. 1, 2, 3, 4, 5 respectively correspond to the UV-vis spectra of systems added with 10, 20, 50, 70, and 100 mg of AgNO3. The inset is the diagram of wavelength of absorption peaks versus its corresponding AgNO3 amount.

