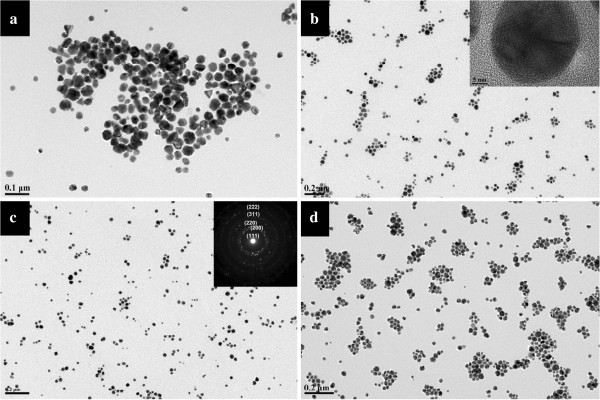
Figure 6.
TEM images of silver particles. These particles were synthesized in the wet systems added with (a) 10, (b) 20, (c) 50, and (d) 100 mg of AgNO3 at 100°C for 3 days. The insets in (b) and (c) are the high-resolution transmission electron microscopic image and SAED patterns taken from a single particle.

