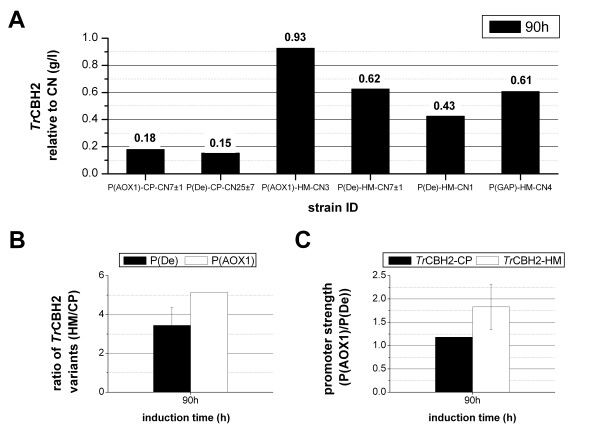
Figure 3.
Comparison ofTrCBH2 gene/ promoter variants normalized to gene copy numbers (CN). Panel A: Protein concentration of TrCBH2 fed-batch cultivations normalized by CN after 90 h of induction. Panel B: Relative ratios of the expression levels of the different gene optimization variants (HM/CP) under the control of P(AOX1) (white bar) and P(De) (black bar). Panel C: Relative ratios of the normalized expression levels of the different methanol inducible promoters (P(AOX1)/P(De)) expressing either TrCBH2-CP (black bars) or TrCBH2-HM (white bar) after 90 h of induction. Please refer to Additional file 2 for the raw data and Results and discussion section for more detailed information

