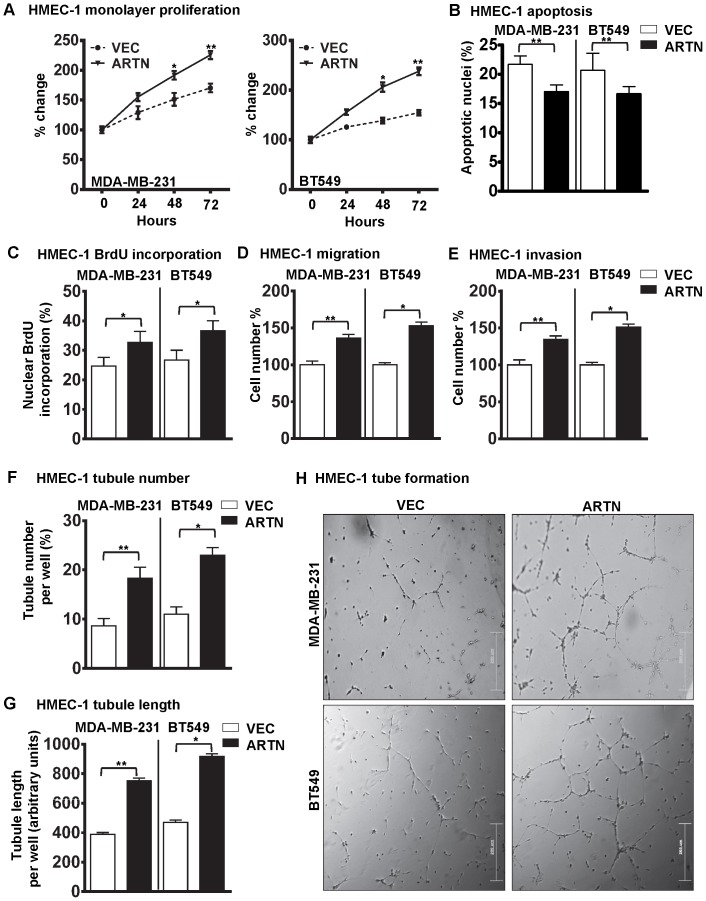
Figure 3. Forced expression of ARTN in ER-MC cells increases the angiogenic potential of HMEC-1 cells.
(A) HMEC-1 monolayer proliferation. HMEC-1 total cell number after indirect co-culture with MDA-MB-231 or BT549 cells with forced expression of ARTN in 2% serum containing media. Empty VEC was used as control. Cell growth was measured at the indicated time points. (B) HMEC-1 apoptotic cell death after 24 h indirect co-culture with MDA-MB-231 or BT549 cells with forced expression of ARTN in serum free conditions. (C) HMEC-1 cell cycle progression after 24 h indirect co-culture with MDA-MB-231 or BT549 cells with forced expression of ARTN in serum free conditions. (D) HMEC-1 cell migration after 24 h indirect co-culture with MDA-MB-231 or BT549 cells with forced expression of ARTN in serum free conditions. (E) HMEC-1 cell invasion assay after 24 h indirect co-culture with MDA-MB-231 or BT549 cells with forced expression of ARTN in serum free conditions. (F) and (G) HMEC-1 cells in vitro tube formation on matrigel after 12 h indirect co-culture with MDA-MB-231 or BT549 cells with forced expression of ARTN in serum free conditions. HMEC-1 tubule number (F) and tubule length (G) was assessed after 12 h. Tubule number was calculated as (number of cells with tubule/total number of cells counted) × 100, whereas tubule length was calculated as an arbitrary units using ImageJ software®. (H) Representative light microscopy images of tube formation. Bar 200 µm.*, p<0.05; **, p<0.01.

