Figure 2.

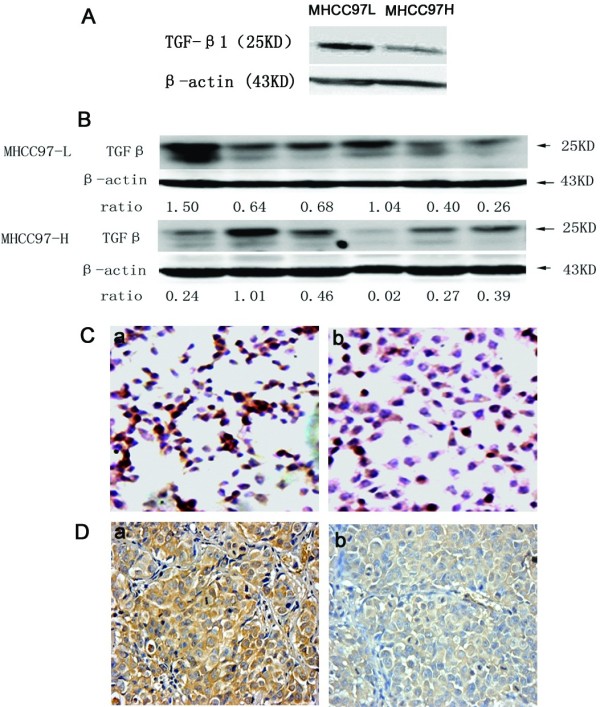
The TGF β/Smads levels in different cell lines and animal models. A) The different expression levels of TGF β in MHCC97-H and MHCC97-L by western blot analysis. (B). Western blot analysis for tumors. TGF β1 (25KD) and β-actin(43KD) bands of samples from two models. Ratio means: ratio of TGF β1 to β-actin bands intensity. C). The different expression levels of TGF β in MHCC97-H and MHCC97-L by cytoimmunochemistry. The brown-yellow color means positive staining, a: MHCC97-L, b: MHCC97-H. (×20 objective field). D) The expression of TGF β1 in MHCC97-H and MHCC97-L models by immunohistochemisty staining, the brown-yellow color means positive staining. a: MHCC97-L model, b: MHCC97-H model. (×20 objective field).
