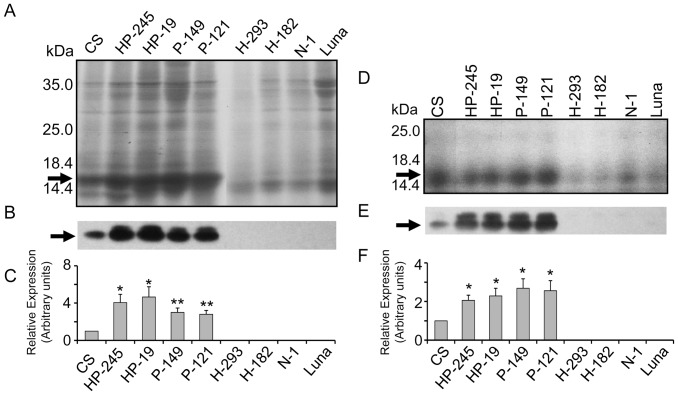
Figure 2. SDS-PAGE and Western blotting analyses of total and starch-bound PINA in transgenic and control lines.
A. SDS-PAGE of TX-114-soluble proteins isolated from flours of transgenic and control lines. B. Western blotting results of total PINA. C. Densitometry quantification of western blotting results of total PINA. D. SDS-PAGE of starch bound puroindolines isolated from flours of transgenic and control lines. E. Western blotting results of starch-bound PINA. F. Densitometry quantification of western blotting results of starch bound PINA. PINA protein is indicated by arrow on both stained SDS-PAGE and Western blots. Data are given as mean ± SEM. *and ** indicates the significant differences with the PINA levels of control variety Chinese Spring at 0.05 or 0.01 probability level, respectively.

