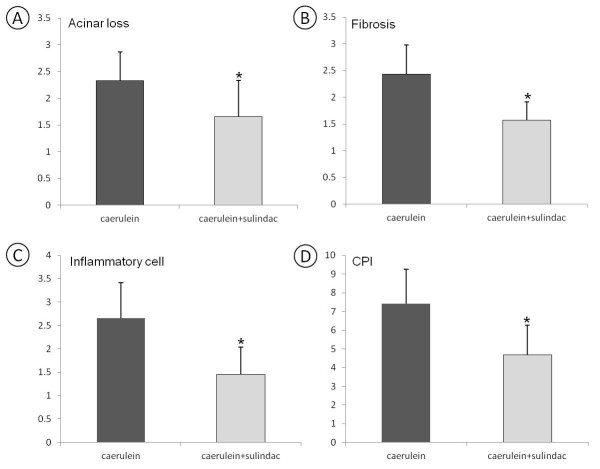
Figure 3.
Semi-quantitative analysis (histogram) of severity of chronic pancreatitis. (A) Amylase and CK19 positive area in the pancreas showing a statistically significant difference in caerulein induced chronic pancreatitis mice with or without sulindac treatment (P < 0.05). (B) The extent of trichrome stain-labeled stromal fibrosis revealing sulindac treatment significantly decreased the extent of fibrosis in caerulein induced chronic pancreatitis mice (p < 0.05). (C) MPO and Mac3 labeled inflammatory cells showing a significantly decrease of neutrophils and macrophages infiltration in the pancreas of caerulein induced chronic pancreatitis mice with sulindac treatment (P < 0.05). (D) Chronic pancreatitis index (CPI) as a summary of the extent of acinar loss, stromal fibrosis and inflammatory cell infiltration showed significant decrease in caerulein induced chronic pancreatitis mice treated with sulindac, comparing with the control mice (p < 0.05.)

