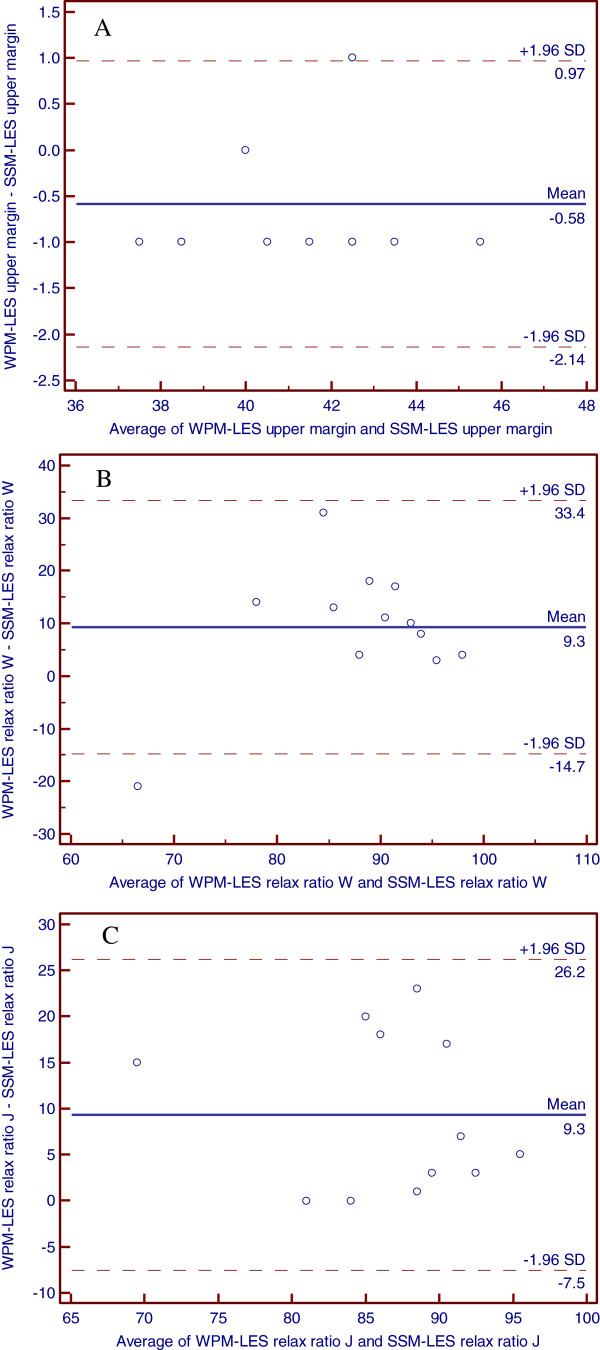
Figure 3.
A: The Bland-Altman plots of LES upper margin between water-perfused manometry and solid-state manometry B: The Bland-Altman plots of LES relax ratio in wet swallow between water-perfused manometry and solid-state manometry C: The Bland-Altman plots of LES relax ratio in jelly pocket swallow between water-perfused manometry and solid-state manometry

