
Figure 1. Rhodopsin expression in mice with various numbers of rhodopsin genes.
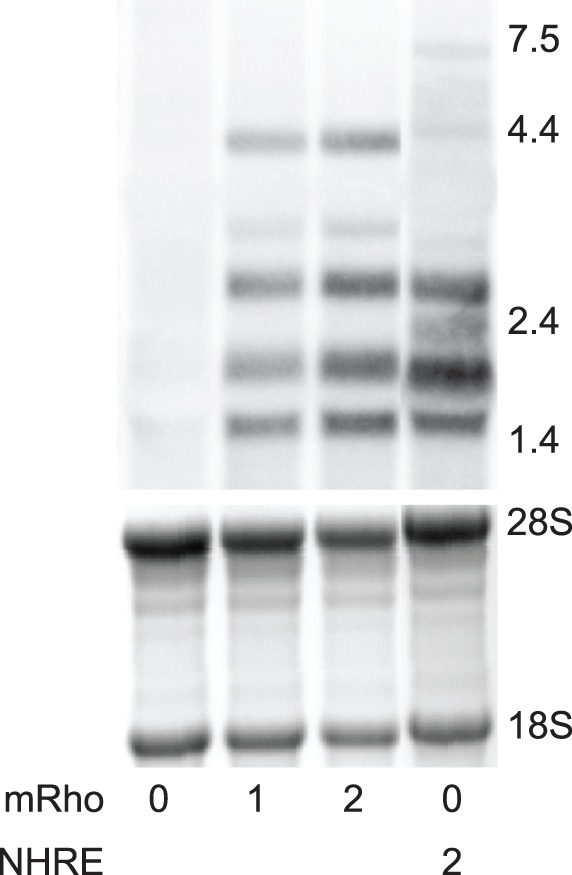
(A) Northern blot analysis of rhodopsin mRNA from various mouse lines. Copy numbers of wild type rhodopsin and P23H-rhodopsin genes are indicated below each lane, where mRho 0 is mRho−/−, mRho 1 is mRho+/−, mRho 2 is mRho+/+, and mRho 0 NHRE 2 is mRho−/−NHRE+/+. Quantification of the 18S and 26S rRNAs bands from the agarose gels prior to transfer (shown as a negative below the Northerns) served as loading controls. Six retinas were used to prepare each mRNA sample. Northern images were obtained on a PhosphorImager. Sizes are indicated in kb.