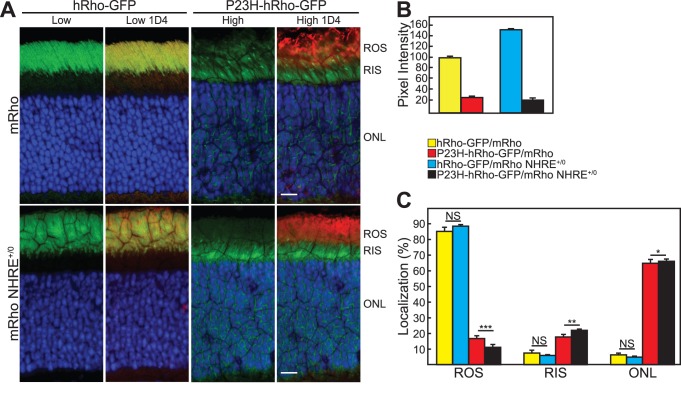
Figure 8. Distribution and quantification of GFP fluorescence in mice expressing hRho-GFP or P23H-hRho-GFP in the presence of 1 or 2 copies of wild type rhodopsin.
(A) Retinas from age-matched hRho-GFP and P23H-hRho-GFP mice were sectioned and stained with DAPI. Sections were imaged using the heterozygous (hRho-GFP/mRho) sections to establish gain and laser power settings that gave limited numbers of saturated pixels in the region of the rod outer segments. These settings are referred to as “Low” and were also used to image retinas from hRho-GFP/mRho NHRE+/0 mice. Due to the lower amounts of P23H-hRho-GFP rhodopsin, retinas from P23H-hRho-GFP/mRho and P23H-hRho-GFP/mRho NHRE+/0 were imaged by increasing the laser power 5-fold, which is referred to as “High.” Immunostaining with 1D4 antibodies, shown in red, identifies the location of wild type rhodopsin. The scale bars are 10 µm. (B) Quantification of average GFP fluorescence intensity. The first and third images from the top and bottom rows in (A) were quantified using ImageJ and expressed relative to hRho-GFP/mRho retinas, which were defined as 100%. (C) Quantification of GFP localization. The amounts of GFP fluorescence the rod outer segments (ROS), rod inner segments (RIS), and outer nuclear layer (ONL) in images like those in the first and third columns of (A) were quantified using ImageJ. For the results displayed in (B) and (C), 5 different sections were examined from each of 4 hRho-GFP/mRho mice, each of 4 hRho-GFP/mRho NHRE+/0 mice, each of 8 P23H-hRho-GFP/mRho mice, and each of 8 P23H-hRho-GFP/mRho NHRE+/0 mice. Retinal sections were derived from various regions across the retina–excluding the periphery and the optic nerve. In all cases, error bars indicate standard deviations. We tested for statistical significance using a multivariate ANOVA with a Least Squares Difference post-hoc analysis. NS, not significant; *, P<0.05; **, P<0.001; ***, P<0.001.

