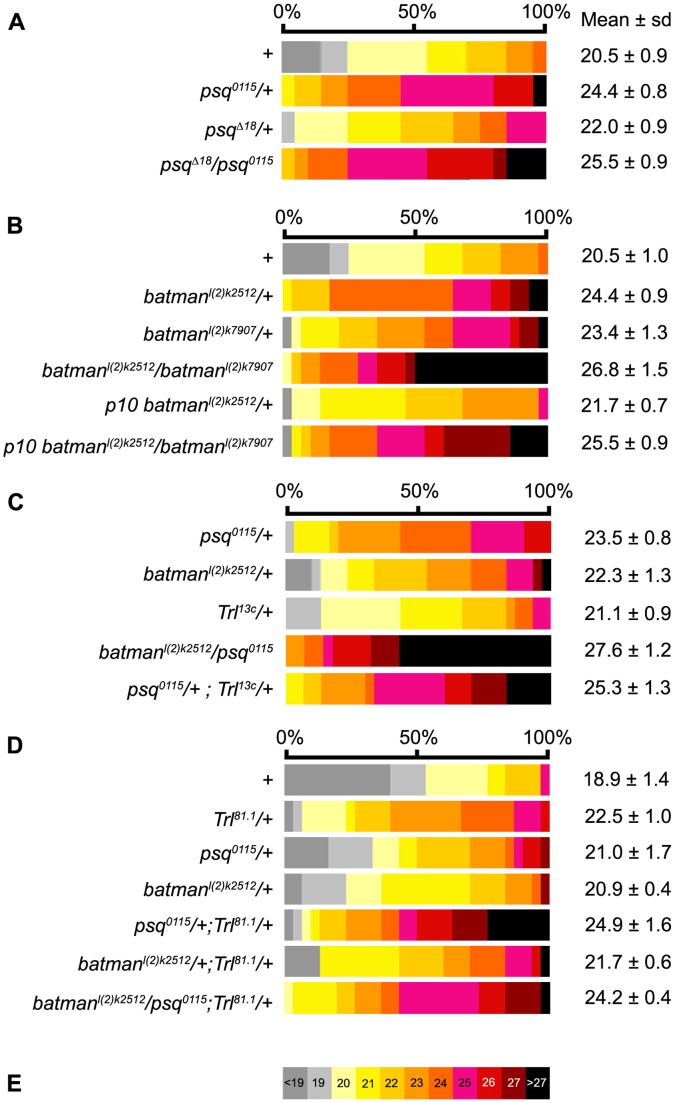
Figure 1. Ovariole number in ttk-BTB group heterozygous combinations.
Distribution of the number of ovarioles per ovary in females carrying psq (A), batman (B) and Trl (C) mutant alleles, and in double and triple heterozygotes (C,D). The wild-type control (+) corresponds to Canton-S. Each phenotypic class corresponding to the indicated number of ovarioles per ovary was attributed a color as defined on the color table shown in E. The same color table was used in all representations of ovariole number distribution in this Figure and in Figures 2 and 3. The mean number of ovarioles per ovary is given to the right of each distribution. All values are expressed as the mean +/− sample standard deviation. The sample size was 30 ovaries except for data presented in the A panel for which sample size was 20. All statistics are shown in Table S1.

