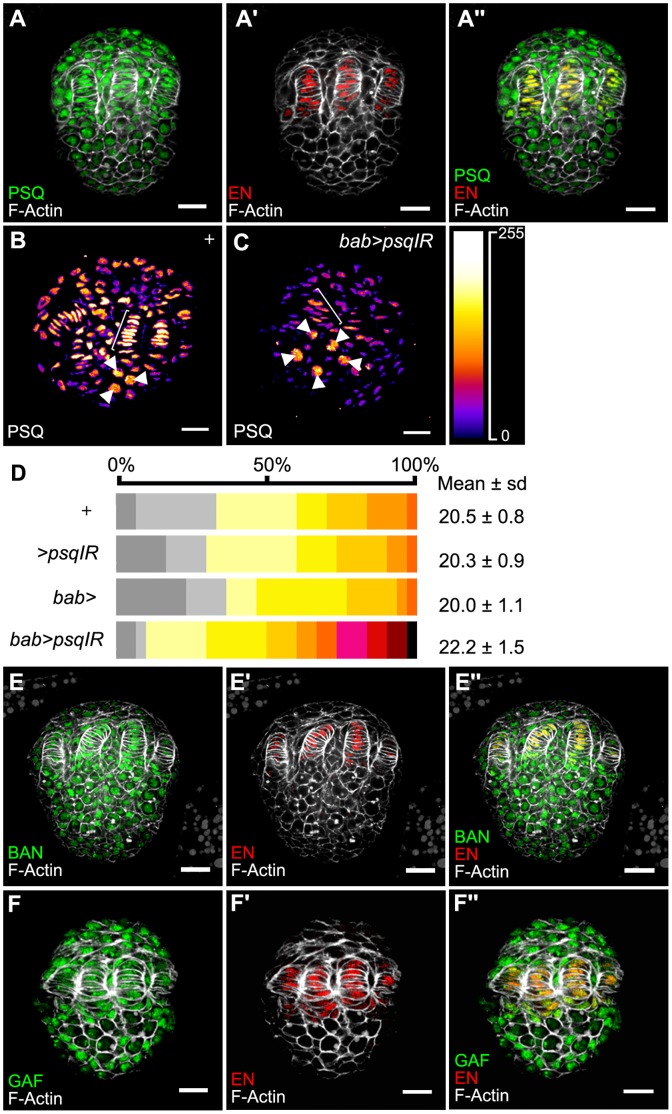
Figure 2. Expression of ttk group proteins in the late third instar larval ovary.
(A) Expression of PSQ (green in A, A’’). TFCs are marked with anti-EN (red in A’, A’’) and cell perimeters with F-Actin (white in all images). (B, C) PSQ levels from bab>psqIR (UAS-psqIR/+; bab-Gal4/+) larval ovaries (C) compared to those of Canton-S (+, B) from the same experimental series. Signal intensity is visualized using the Fire Lookup Table (ImageJ, NIH, inset on the right). The UAS/Gal4 constructs used in this experiment allow expression of Gal4 in somatic cells but not in the germ cells. In bab>psqIR, when compared to + ovaries, signal intensity decreases in somatic cells, including TFs (brackets) and remains constant in germ cells (arrowheads). Scale bar: 20 µm. (D) Distribution of the number of ovarioles per ovary in bab-Gal4 and UAS-psqIR combinations. Color table as in Figure 1. The mean number of ovarioles per ovary is given on the right. All values are expressed as the mean +/− sample standard deviation. The sample size was 30 ovaries. All statistics are shown in Table S2A. (E,F) Batman (green, E, E’’) and TRL/GAF (green, F, F’’) expression in L3 ovaries. TFCs are marked with anti-EN (red in E’, E’’, F’, F’’) and cell perimeters with F-Actin (white in all images). Scale bar : 20 µm.

