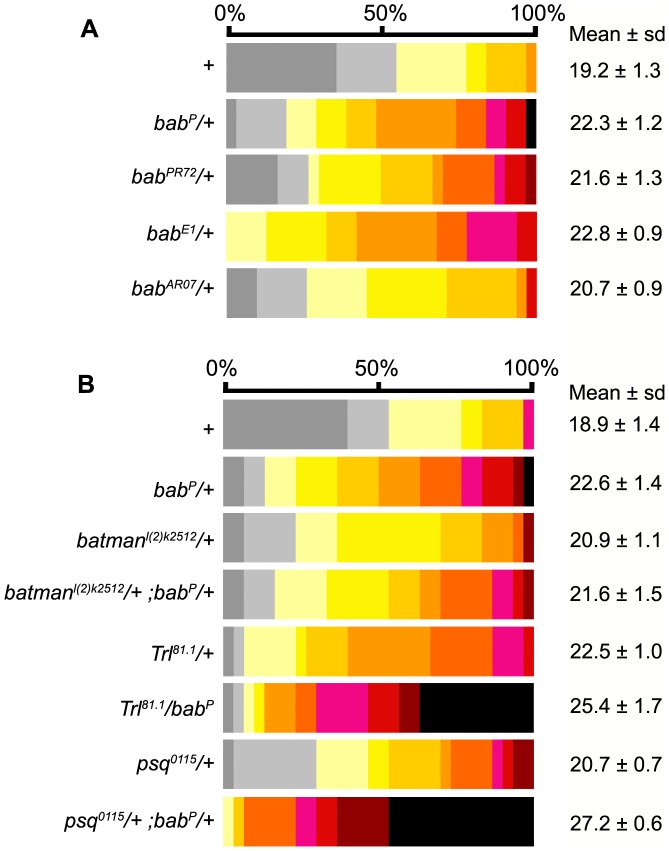
Figure 3. Ovariole number in bab mutant heterozygous combinations.
(A) Distribution of the number of ovarioles per ovary in different bab heterozygotes. For statistics (comparison between bab heterozygotes and Canton-S (+)) see Table S3A. (B) Distribution of the number of ovarioles per ovary in genetic interaction assays between the bab locus and psq, Trl and batman. For statistics (comparison between different allelic combinations) see Table S3B. The mean number of ovarioles per ovary is given on the right. All values are expressed as the mean +/− sample standard deviation. Color table as in Figure 1.

