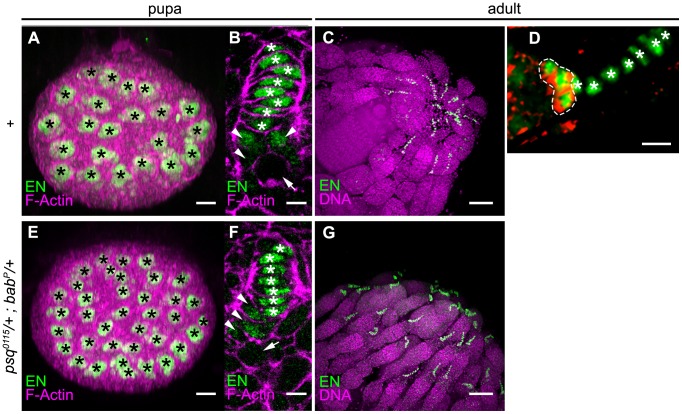
Figure 4. Detection of TFCs in the pupal and in the adult ovary.
(A–D) Wild type control (Canton-S). (E–G) psq0115/+; babP/+ heterozygotes. EN positive (green) cells include two cell populations, TFCs (white stars in B, D, F), and CC (arrowheads in B, F, circled by a dotted white line in D). At the early pupal stage (A, B, E, F), confocal projections through the anterior/posterior axis of ovaries (A, E) allows counting of the number of TF per ovary (each TF is marked by a black star). Sections through individual early pupal TFs (B, F) allow discrimination between TFCs with a flattened nucleus (white stars) and CCs with a more rounded nucleus (arrowheads in B, F) located posterior to TFCs. Germ cells are marked by an arrow. In one-day-old flies (C, D, G), counting of TFs and TFCs was performed on confocal 3D stacks from whole mount ovaries stained with anti-En (green), anti DE-Cadherin (red, in D) and TO-PRO-3® (purple, in D, G). TFs protrude at the tip of the germarium. In the germarium, CCs (circled by a dotted white line) accumulate high levels of DE-cadherin (red), whereas the adjacent basal TFCs do not. Anterior to the right. Scale bar : (A, E) 10 µm, (B,F) 2.5 µm, (C, G) 40 µm, (D) 5 µm.

