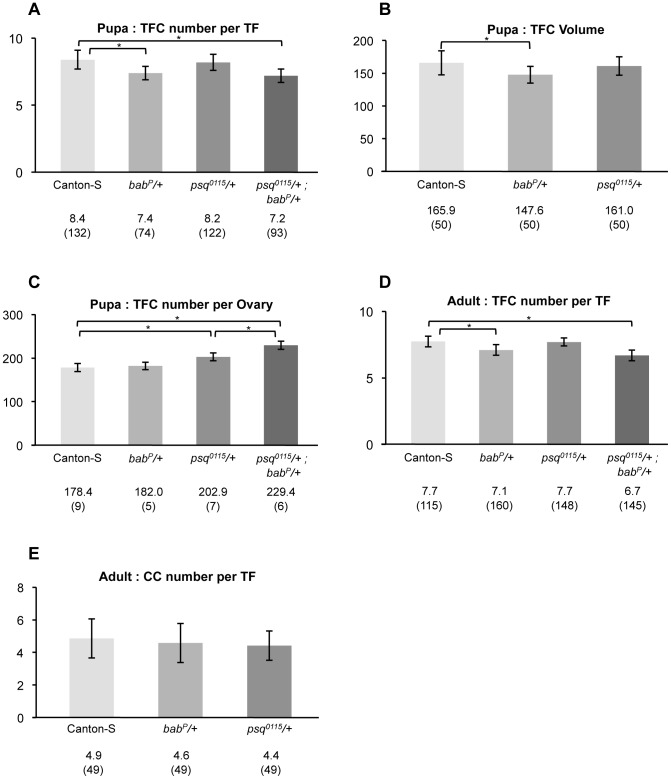
Figure 5. Quantitative analysis of cell number and size in psq and bab heterozygotes.
(A) TFC number per TF at the early pupal stage. (B) TFC volume at the early pupal stage. (C) TFC number per ovary at the early pupal stage. (D) TFC number per TF in adults. (E) CC number per germarium in adults. Canton-S flies were used as a wild-type reference. Genotypes are given below each chart. In heterozygotes, +indicates wild type chromosomes from the Canton-S stock. For each genotype, values are expressed as the mean number (A, C–E), or mean volume (B) and sample size is given in parenthesis. Significant differences between genotypes are marked by a bracket and asterisk. All p values are given in Table S4.

