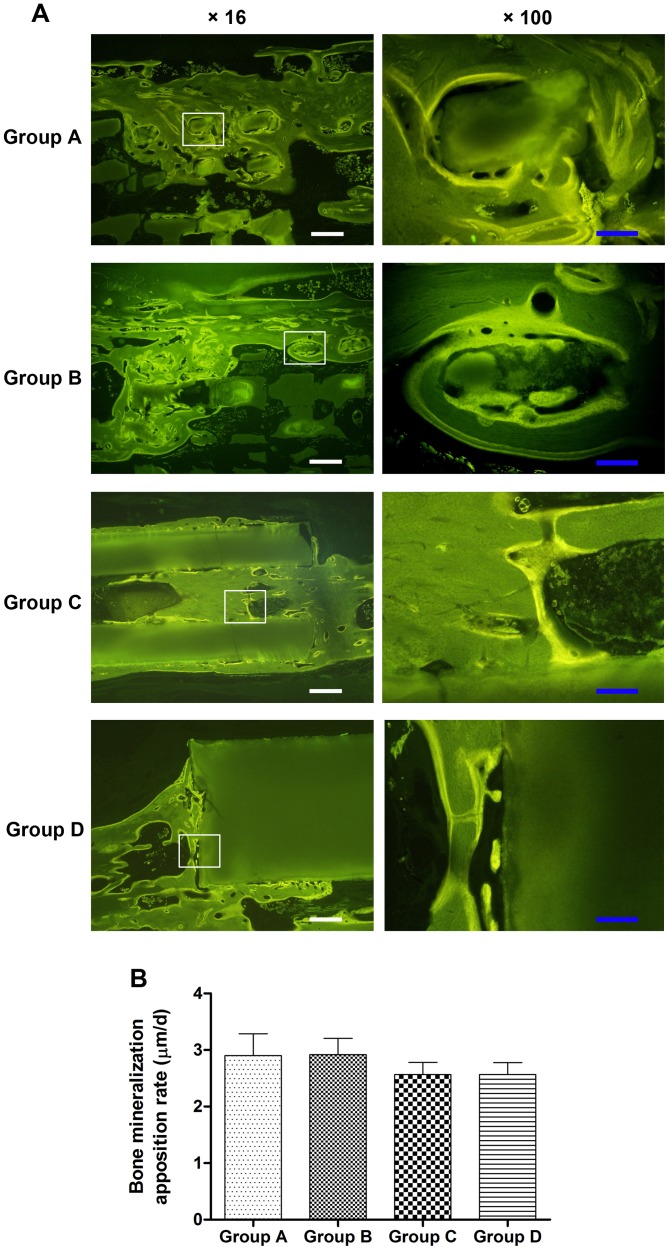
Figure 4. Fluorochrome labeling of bone regeneration at 12 weeks post-surgery.
(A) The fluorescent labeling images indicated that more new bone growth into the porous (Group A–B) and tubular scaffolds (Group C), while very limited bone tissue formed around the solid scaffolds (Group D). (B) Quantitative analysis showed there were no significant differences in the bone mineralization apposition rate (p>0.05), indicating similar bone growth rate in these four kinds of scaffolds. Scale bar: 50 µm (white), 10 µm (blue).

