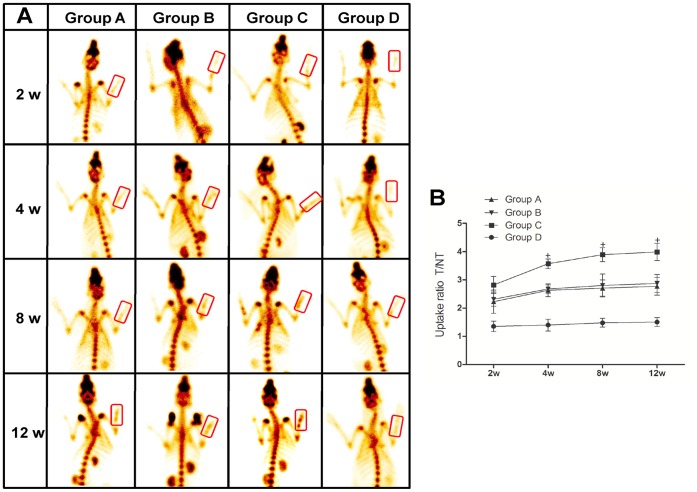
Figure 9. ECT analysis of vascularization at 2, 4, 8 and 12 weeks post-surgery.
(A) ECT images of rabbits showed that despite of no difference among the four groups at 2 weeks post-surgery, higher counts were observed in tubular scaffolds (Group C) than other groups (Group A, B and D) since week 4 post-surgery, suggesting enhanced vascularization and metabolic activities. (B) Quantitative measurement of the uptake ratio (T/NT) further confirmed better vascularization and higher metabolic activities of tubular scaffolds than others since week 4 post-surgery (+ p<0.05 vs. Group A, B and D).

