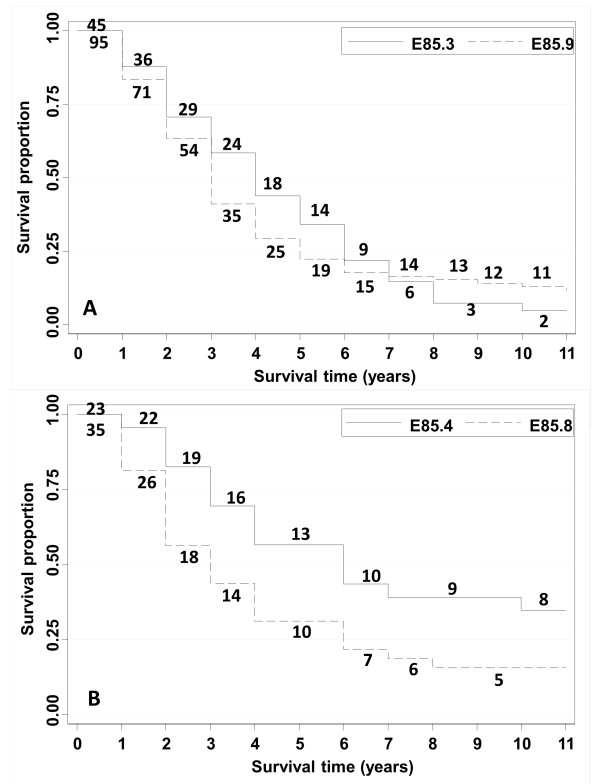
Figure 2.
Kaplan-Meier survival estimates for the subtypes of hospitalized patients with amyloidosis by subtypes. The figures next to the graphs show the patients at risk in each year of follow-up. Figure 2 top: Secondary systemic amyloidosis (E85.3) and amyloidosis, unspecified (E85.9); Figure 2 bottom: Organ-limited amyloidosis (E85.4) and other amyloidosis (E85.8).

