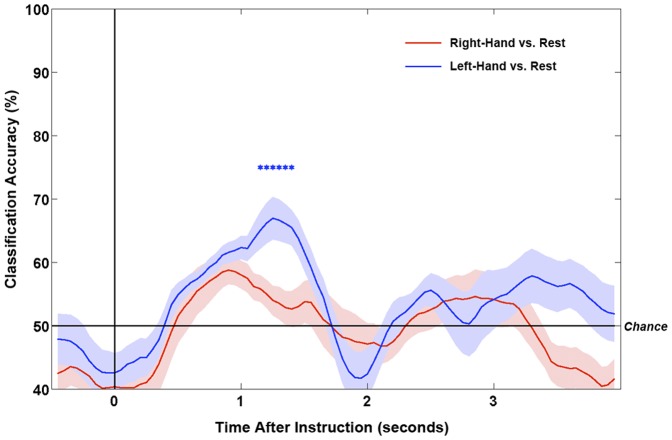
Figure 4. Time-courses of classification accuracies (versus rest) for right-hand and left-hand trials for the patient.
Lines show means of the 10-fold smoothed classification accuracies. Shaded areas show ±1 standard errors. Stars denote time-points with significantly above chance classification for left-hand vs. rest (p<.025).

