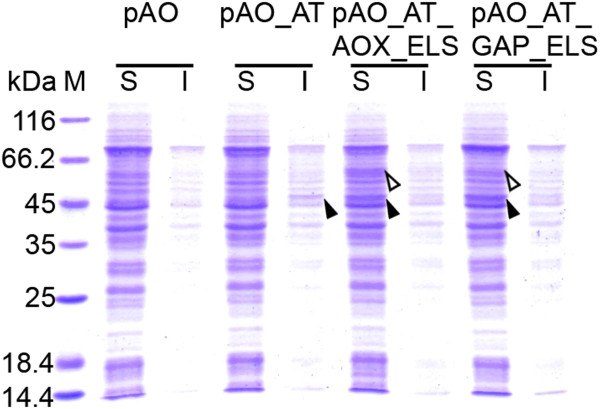
Figure 6.
SDS-PAGE analysis of soluble (S) and insoluble (I) protein fractions from P. pastoris KM71 expressing D-PhgAT alone and with GroEL-GroES co-expression. Lane M, molecular mass markers; pAO, clone with blank pAO815; pAO_AT, clone expressing dpgA under PAOX1; pAO_AT_AOX_ELS, clone expressing PAOX1 dpgA with co-expressing PAOX1groEL and PAOX1 groES; pAO_AT_GAP_ELS, clone expressing PAOX1 dpgA with co-expressing PGAP groEL and PGAP groES. The protein bands corresponding to D-PhgAT (45 kDa) and GroEL (60 kDa) are arrow indicated.

