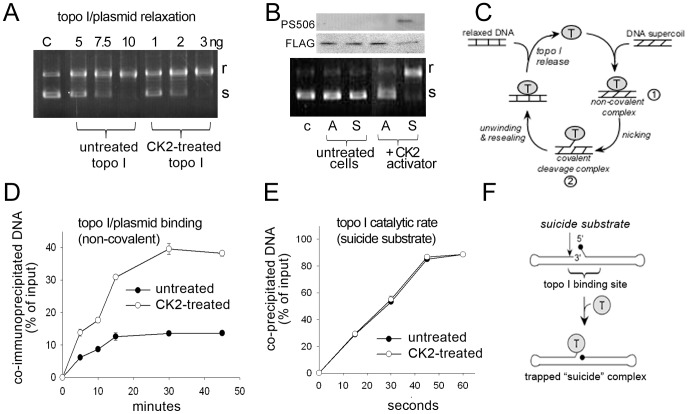
Figure 2. Effects of hyperphosphorylation on topo I binding, relaxation, and nicking activity.
(A) Agarose gel electrophoresis of products of a supercoiled plasmid DNA relaxation assay carried out with basal or hyperphosphorylated R-topo I. Reactions contained 5, 7.5, or 10 ng of basal phosphorylated R-topo I, or 1, 2, or 3 ng of hyperphosphorylated R-topo I. C = untreated plasmid control, s = supercoiled DNA, r = relaxed DNA. (B) (Top) Western analysis of PS506 and FLAG expression in cobalt agarose-selected A506 (“A”) and wild-type (S506, “S”) gene products. Nuclear extracts of transduced SW480 cells were collected before or 2 days after treatment with the CK2 activator 1-ethyl-4,5-dicarbamoyl imidazole. Each lane represents 75 µg. (Bottom) Agarose gel showing results of a plasmid relaxation assay carried out with the same cobalt agarose-selected proteins. C = untreated control plasmid. (C) Schematic of the steps in topo I-mediated relaxation of DNA supercoils, involving non-covalent association of topo I with DNA (intermediate  ) followed by catalytic single-strand nicking (intermediate
  ). (D) Time course of non-covalent association of 0.3 pmol basal (•) or hyperphosphorylated (○) R-topo I to 0.03 pmol of radiolabeled plasmid DNA. Topo I–DNA complexes were recovered and DNA quantified by scintillation counting. Results show the % of input DNA present in DNA–topo I complexes. (E) Catalytic rate of basal (•) and hyperphosphorylated (○) R-topo I on a synthetic suicide substrate following the formation of non-covalent complexes at 4°C. (F) Diagram of hairpin structure of suicide substrate showing topo I cleavage sequence (↓) and blocked 5′-end carrying a phosphate group (•). Diagram adapted from reference [26] with permission from Oxford University Press.

