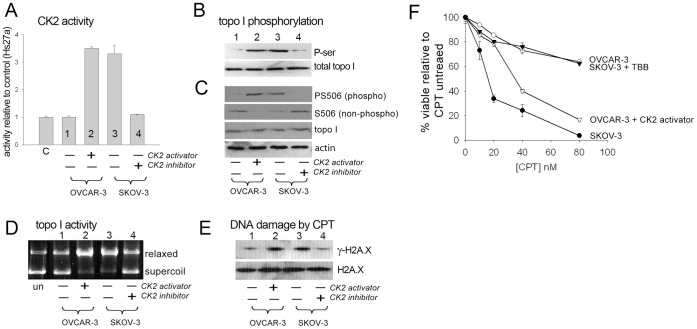
Figure 3. Modulation of CK2 activity and effects on topo I and cellular camptothecin responses.
(A) CK2 activity measured in OVCAR-3 and SKOV-3 ovarian cancer cell lysates, before and after experimental modulation of CK2 levels. CK2 level in the control (C) Hs27a stromal cell line is shown for comparison. (B) Topo I serine phosphorylation status in OVCAR-3 and SKOV-3 cells before and after modulation of CK2 levels. Cell lysates (175 µg) were immunoprecipitated with goat anti-topo I C-terminal followed by Western analysis of phosphoserine (P-ser) or total topo I. (C) Western analysis of topo I PS506, S506, total topo I, and actin in lysates of OVCAR-3 and SKOV-3 cells before and after modulation of CK2 levels. Each lane represents 75 µg. (D) Topo I activity assayed by conversion of supercoiled plasmid DNA to the relaxed form by nuclear extracts prepared from OVCAR-3 or SKOV-3 cells before and after modulation of CK2 levels. First lane shows control, untreated plasmid. (E) Western analysis of γ-H2A.X expression as a marker of DNA damage in lysates of OVCAR-3 or SKOV-3 cells before or after modulation of CK2 levels, and following a 1 h exposure to 10 µM camptothecin (CPT). (F) Viability of OVCAR-3 or SKOV-3 cells on day 3 with or without experimental modulation of CK2, and following 18 h exposure to the indicated doses of camptothecin (CPT).

