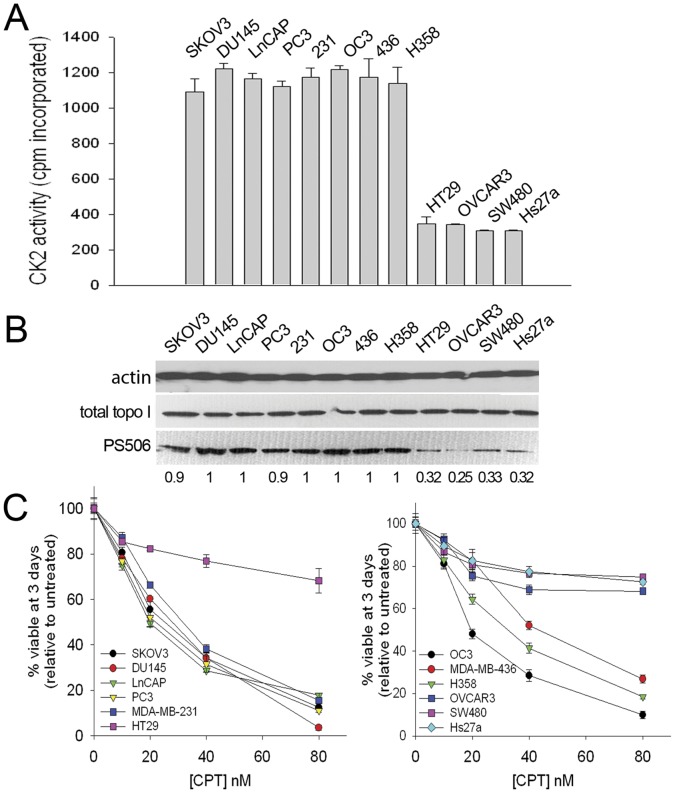
Figure 4. Correlation of CK2 activity, PS506 expression, and camptothecin sensitivity in cancer cell lines.
(A) CK2 activity in cell lysates of the indicated cell lines. (B) Western analysis of PS506, total topo I, and actin in lysates of the indicated cell lines. Each lane contains 75 µg of cell lysate. Numbers below lanes refer to the intensities of the PS506 band relative to H358, as determined digitally. (C) Day 3 viability assays of the indicated cell lines following exposure to the indicated doses of camptothecin (CPT) for the first 18 h of the incubation.

