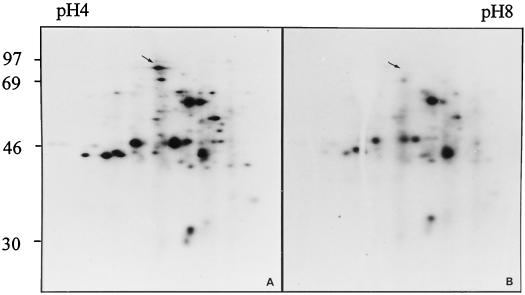
Figure 3.
Proteins synthesized in line W22 roots of the Sh1Sus1 (A) and the sh1sus1 (B) genotype during HPT. Proteins synthesized during HPT were analyzed by two-dimensional IEF/SDS-PAGE. The numbers to the left indicate the position of the molecular mass markers (in kilodaltons). The arrows indicate the position of SuSy.

