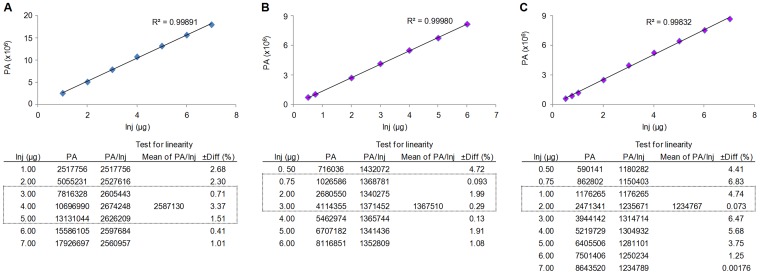
Figure 3. Calibration curves and corresponding data for the three compounds of interest, chlorogenic acid (Fig. 3A), rutin (Fig. 3B) and isoquercitrin (Fig. 3C).
Inj: injected amount, PA: peak area, ±Diff(%): difference between the actual value of PA/inj and the averages of each such value in the table, which difference should be less than 5%. Dashed frames in each data table represent ranges where corresponding peak areas of the extracts were found when tested.

