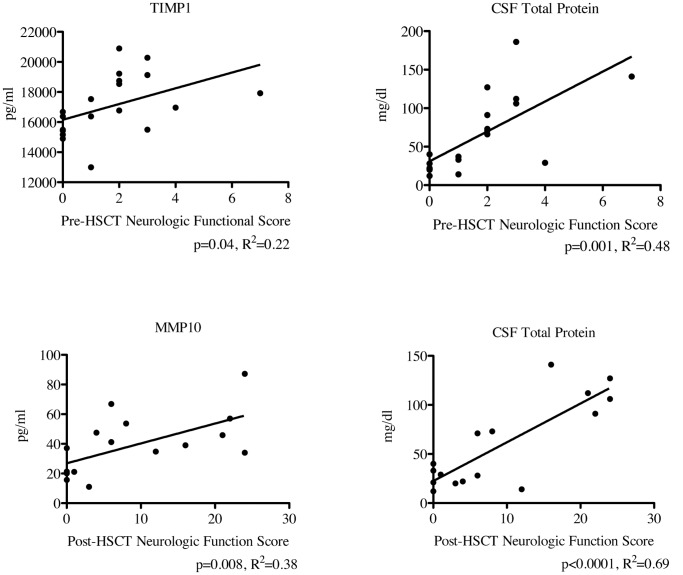
Figure 5. Levels of CSF TIMP, MMP10, and total protein correlate with neurologic score pre- and post-HSCT.
Regression analysis was performed using the previously determined MMP and TIMP levels and each patient’s pre- and post-HCT neurologic function score. The post-HSCT scores were determined at the one year post-HCT follow-up visit. P-values and R2 were determined using Prism software (version 5.0d).

