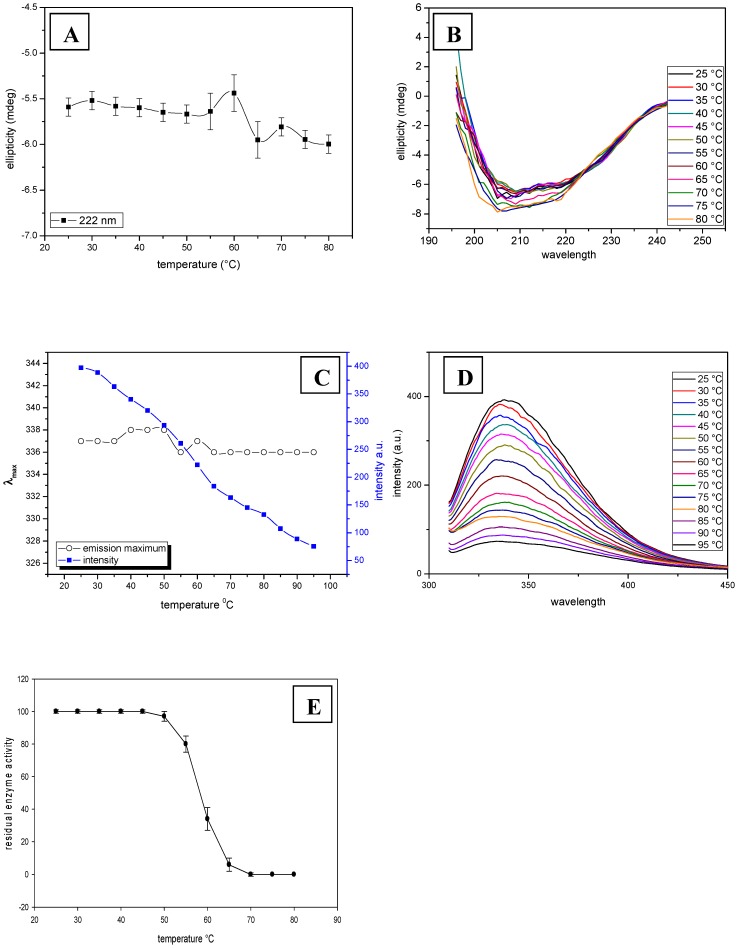
Figure 2. Thermal denaturation.
Ellipticity (A & B) and emission (C & D) measurement of CpGAL as a function of temperature. Emission shows monotonous decrease in the intensity of λmax with increasing temperature. (E) Represents residual enzymatic activity as a function of heat denaturation for 5 min, at respective temperatures.

