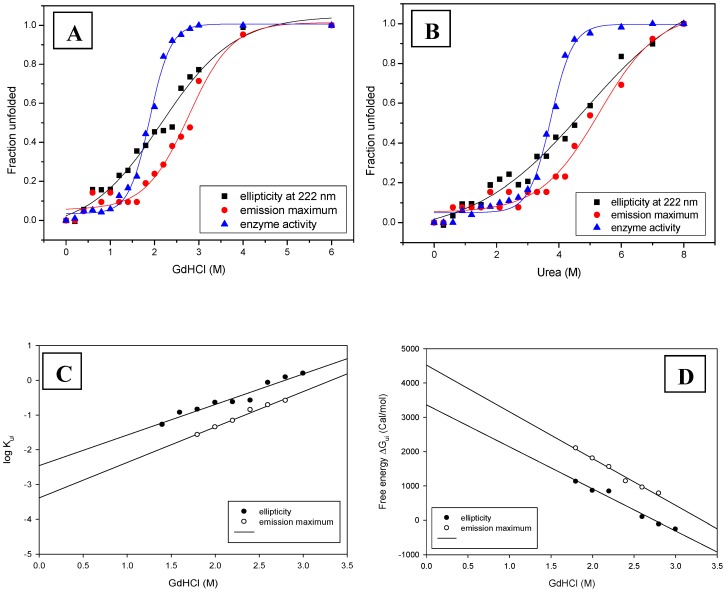
Figure 4. Chemical induced conformational changes.
(A) & (B) represents GdHCl and urea mediated transitions of protein unfolding, respectively. (C) Represents free energy of unfolding, whereas (D) represents unfolding kinetics rate constants (Half Chevron plot) against GdHCl. Intercepts at y axis gives ΔG0 and log Kobs, respectively.

