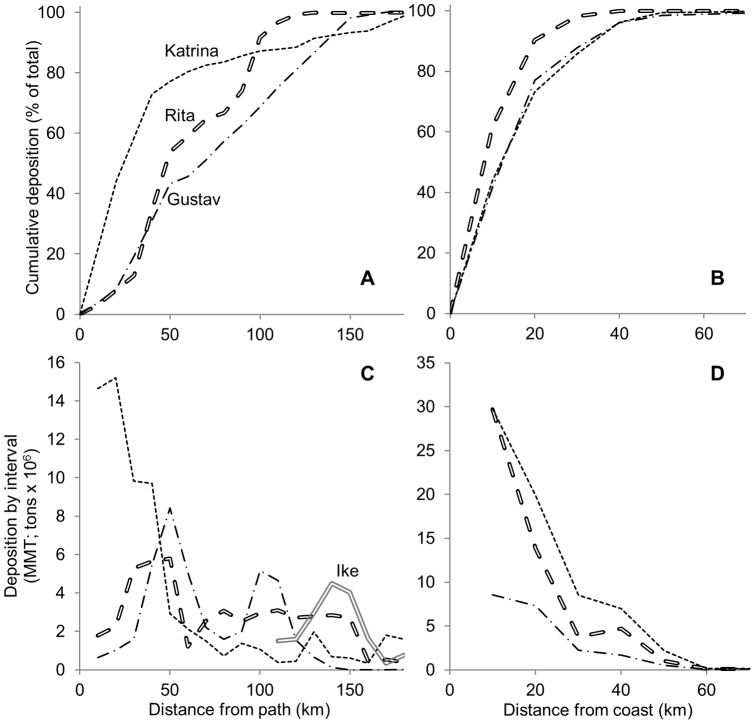
Figure 3. Distribution of mineral sediment with respect to distance from storm path and distance from coastline.
The top panels (A, B) show cumulative deposition and bottom panels (C, D) show deposition within each 10 km interval, plotted at the midpoint. The panels at left (A, C) show distance from path and the panels at right (B, D) show distance from coast. Deposition is based on spatially interpolated sediment distribution measured at 10 km increments. Deposition is measured east of the storm path for Gustav, Rita, and Ike, and on both sides for Katrina because of the distinct distribution of sediment. The data for Hurricane Ike in panel C is for the Louisiana portion of the deposition footprint; Texas is excluded.

