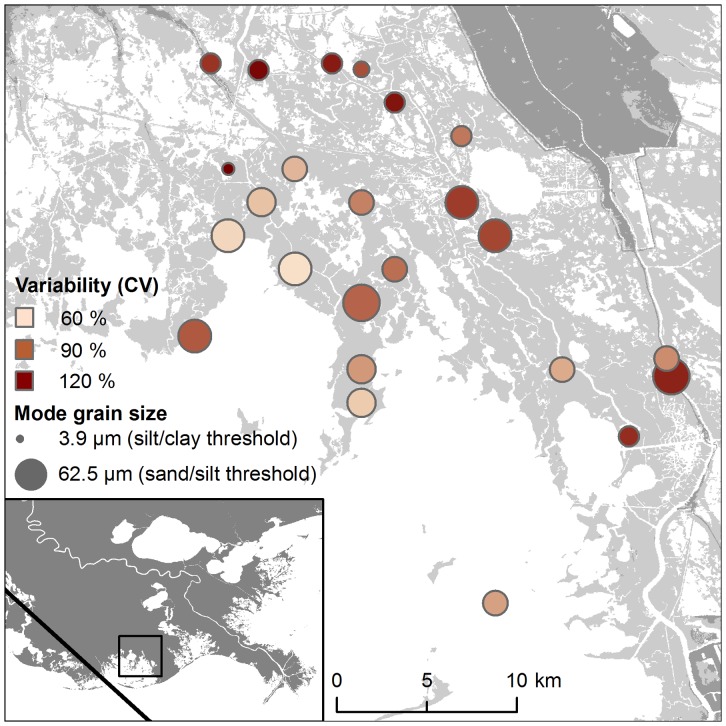
Figure 5. Mode grain size and variability for a subsample of sediments from Hurricane Gustav.
The grain sizes decrease (symbol size) and are more poorly sorted (symbol color) with distance from open water. Variability is calculated as the coefficient of variation (CV). Inset shows sample area and track of Hurricane Gustav.

