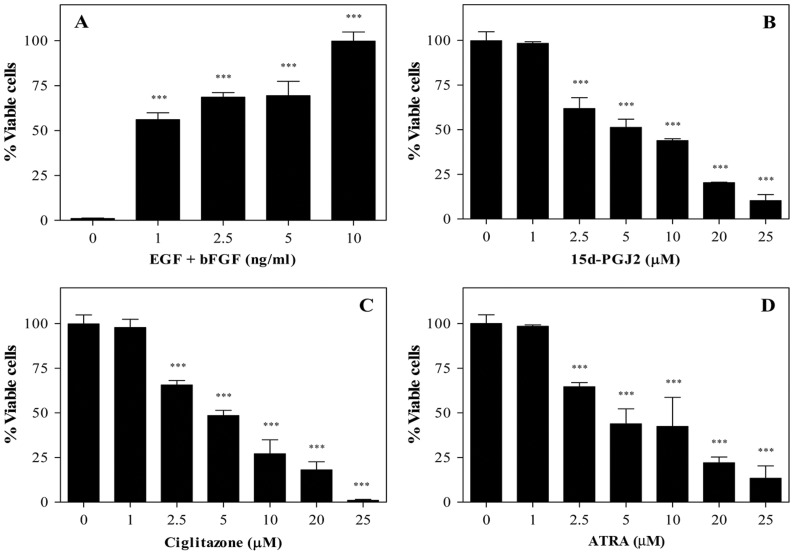
Figure 2. Inhibition of NSC proliferation by PPARγ agonists.
NSCs dissociated from 7–10 day old neurospheres were cultured in 96 well tissue culture plates (1×10⁴/0.2 ml/well) in NBM+B27 with different doses of EGF+bFGF (A) or 10 ng/ml EGF+bFGF in the presence of different doses of 15d-PGJ2 (B), ciglitazone (C) and ATRA (D). The cell proliferation/viability was measured by WST-1 assay. The values are means of triplicates±SD and the p values are expressed as *(p<0.05), **(p<0.01), and ***(p<0.001). The figure is a representative of three independent experiments.

