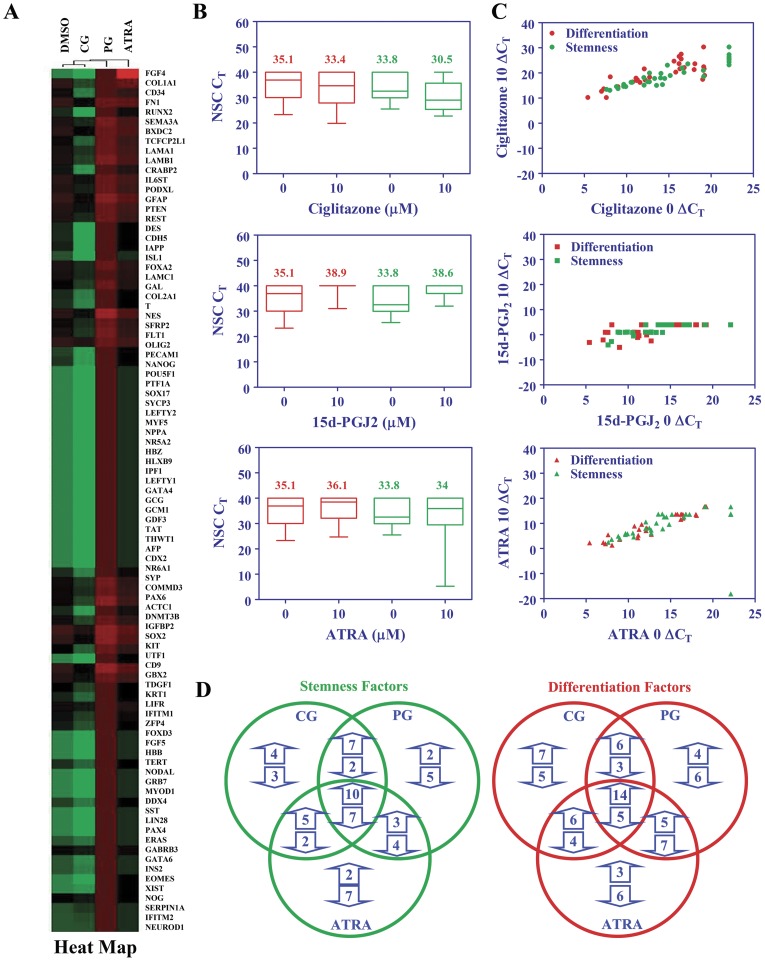
Figure 6. Regulation of stemness and differentiation genes by PPARγ agonists in NSCs.
NSCs were cultured in NBM+B27 with 10 ng/ml EGF+bFGF in the presence of 0 or 1 µM ciglitazone, 15d-PGJ2 or ATRA for 3 days and the stem cell gene expression analyzed by qRT-PCR. (A) Heat map showing the expression levels of stemness and differentiation genes in NSCs treated with agonists compared to control. (B) Box plots showing the CT values of differentiation (Red) and stemness (Green) genes in NSCs treated with agonists compared to control. (C) Scatter plots showing ΔCT values of differentiation (Red) and stemness (Green) genes in NSCs treated with agonists compared to control. (D) Number of stemness and differentiation genes altered is presented as Venn diagram. The figure is representative of two independent experiments.

