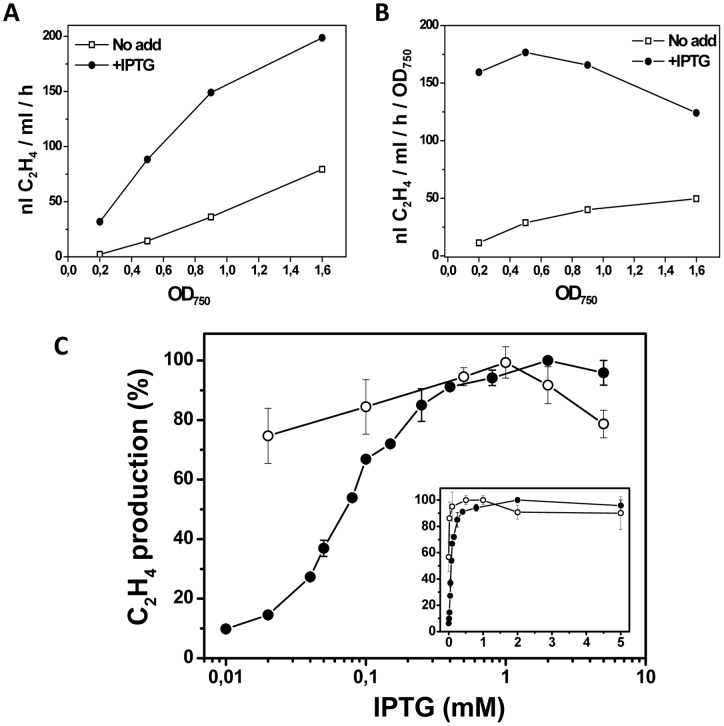
Figure 5. The effect of IPTG concentration, promoter and cell density on the relative rate of ethylene synthesis in Synechocystis.
(A) The rate of ethylene synthesis with pDF-lac-EFEh (PA1LacO-1) in response to the optical density of the culture and the presence or absence of IPTG. Open squares: No IPTG addition. Closed circles: 1 mM IPTG. (B) is identical to (A) with the exception that the rate of ethylene synthesis is shown relative to the optical density. (C) The rate of ethylene synthesis in response to IPTG concentration (logarithmic scale) with pDF-trc-EFEh (Ptrc, black closed symbols), pDF-lac-EFEh (PA1lacO-1, white open symbols). All cultures were measured at approximately the same optical density (OD750 = 0.5). The inset graph differs only from the larger graph by having a linear scale on the X-axis.

