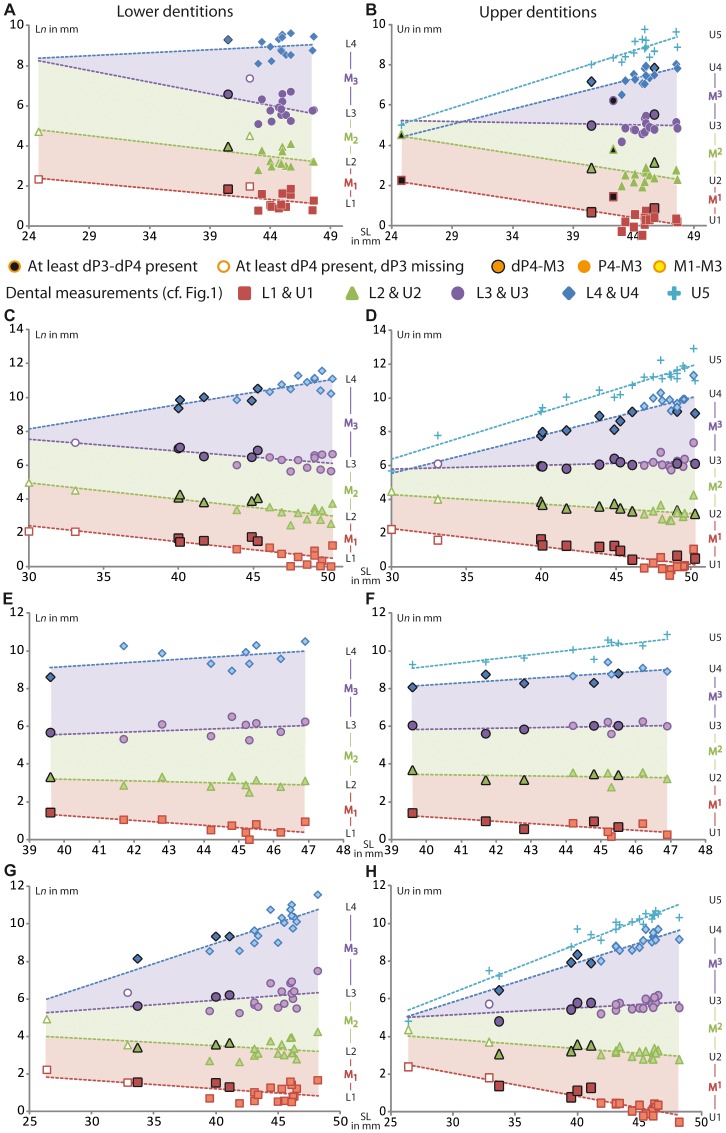
Figure 3. Graphs including skull measurements highlighting mesial drift for each extant ctenodactylid.
A–B, Pectinator spekei, C–D, Ctenodactylus gundi, E–F, Felovia vae and G–H, Massoutiera mzabi. Ln: measurements for right lower dentition; Un: measurements for right upper dentition, SL: Skull length. Red, green and violet areas show the evolution of M1, M2 and M3 length respectively, compared to skull length.

