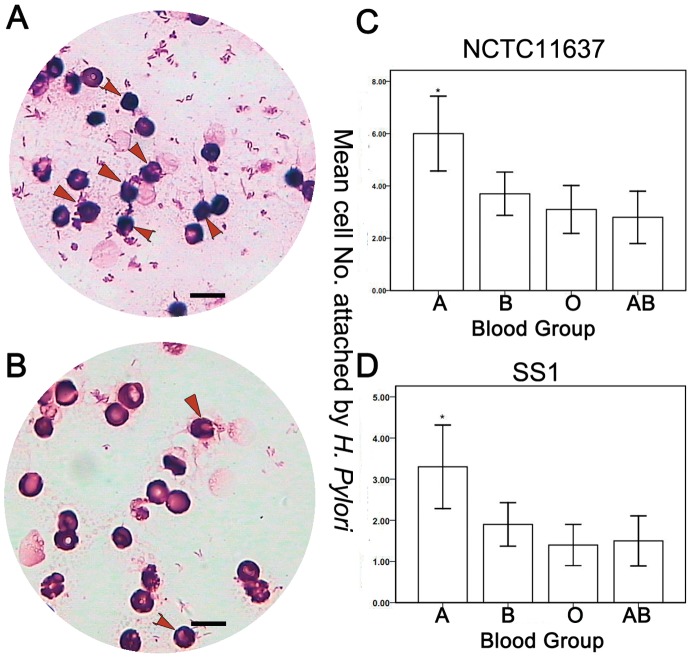
Figure 1. Co-culture of NCTC11637 strain with erythrocytes.
(A) Type A erythrocytes. More type A erythrocytes have H. pylori attached to them (arrow). (B) Type O erythrocytes. These have fewer H. pylori attached to them (arrow). (C) The mean number of erythrocytes with H. pylori NCTC11637 strain in each ABO blood group is shown in the bar chart. * indicates that the number of type A erythrocytes is significantly higher than other groups (P<0.05). No significant difference is found between other blood groups. (D) The mean number of erythrocytes with H. pylori SS1 strain in each ABO blood group is shown in the bar chart. * indicates that the number of erythrocytes in blood group A was found to be significantly higher than in other groups (P<0.05). No significant difference is found between other groups (Wright-Giemsa, 1000×). In figure 1C and 1D, the values represent as mean ± standard deviation. The scale bar reprensents the 10 µm.

