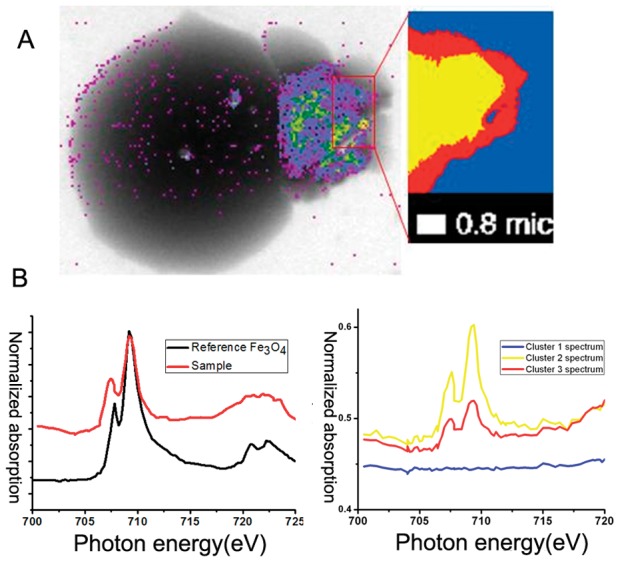
Figure 4. Stack analysis of the interaction between human erythrocyte with NCTC11637 strain.

(A) We selected a portion of the bacterial colonies (magnification on upper-right corner) for the stack scan. (B) Left: the image of photon absorption was obtained from this stack scan for standard Fe3O4. Right: the image of photon absorption was obtained from this stack scan for NCTC11637 strain. The horizontal labels indicate photon energy and the vertical axis indicates normalized absorption. The yellow, red, and blue lines corresponded to the color regions of the figure (A, magnification on upper-right corner) using L-edge soft X-ray imaging.
