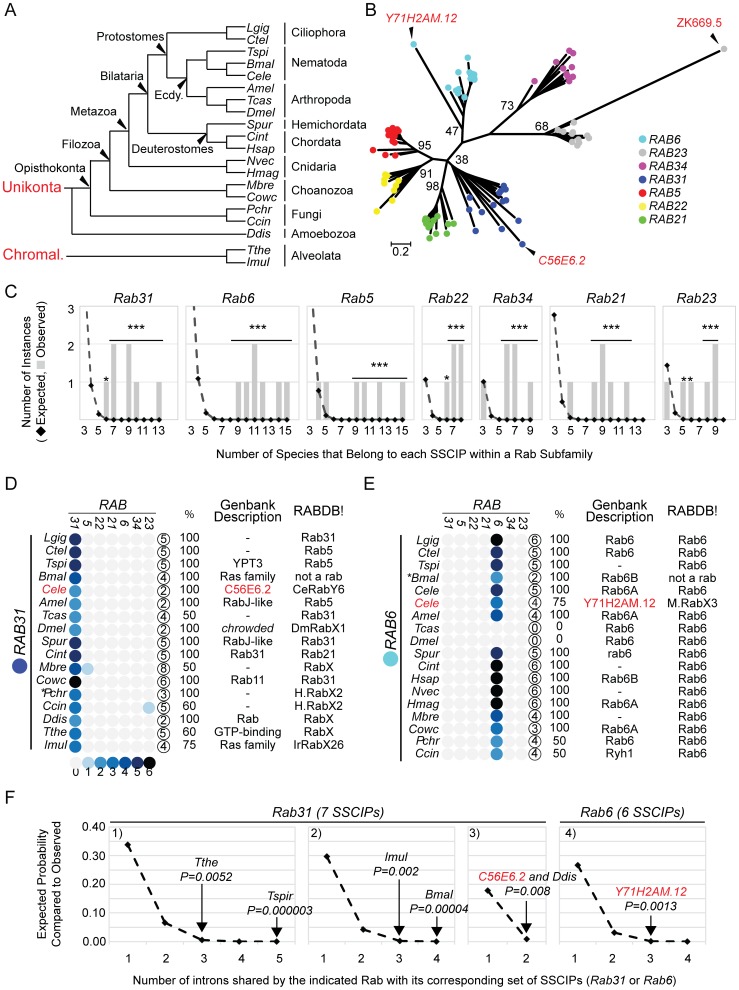
Figure 4. Comparative analysis of intron position among diverse Rab subfamily members.
A) Cladogram indicating evolutionary relationships of 18 species examined here [128]–[130]. Ecdy. = Ecdysozoa, Chromal. = Chromalveolata. For species abbreviations see Methods. B) An ML tree of Opisthokonts created from the MSA used to map intron positions. Bootstrap support (100 replicates) is indicated for each subfamily cluster. C) For each subfamily, the number of times a Subfamily Specific Conserved Intron Position (SSCIP) involving the indicated number of species was observed (gray bars), compared to what is expected by chance (black diamonds). The difference between observed and expected is statistically significant where indicated. *P(Monte Carlo) <0.05. ***P(Monte Carlo)≤0.00001. The Rab31, 6, 5, 22, 34, 21 and 23 subfamilies include 17, 18, 17, 9, 9, 10, 14 and 12 species, respectively. D) and E) Heat map indicating number of introns within Rab31 (D) or Rab6 (E) that match SSCIPs from Rab31, 5, 22, 21, 6, 34 and 23. The circled number indicates the number of introns present in the MSA for each gene. % equals the percentage of introns that are shared with the true SSCIP. C56E6.2 (D) and Y71H2AM.12 (E) are highlighted red. Genbank Descriptions (if any) and RABDB! classifications are included. Classification abbreviations include: HypoRabX1 (H.RabX1), HypoRabX2 (H.RabX2), HypoRabX3 (H.RabX3) and MetazoaRabX3 (M.RabX3). F) A pairwise comparison of intron position conservation between specific genes (Rab31 at left, Rab6 at right) and their corresponding set of SSCIPs. Black diamonds plot the probability that a specific number of intron matches would be expected by chance for each set of conditions. Chart 1 plots a comparison of 5 introns with 7 SSCIPs (5×7). Chart 2∶4×7. Chart 3∶2×7. Chart 4∶4×6. Observed values for a subset of genes are indicated with P values estimated from the Monte Carlo simulation data (See text and methods). Species abbreviations are as in A. C) and F) 72 protosplice sites assumed.

