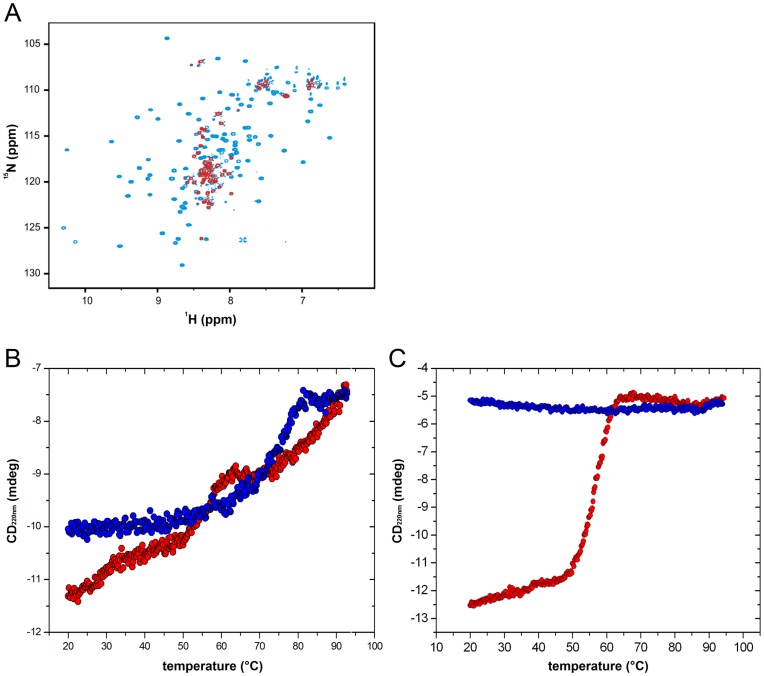
Figure 2. In vitro dissociation of YscUC.
(A) 1H-15N HSQC spectra of YscUC at 20°C, pH 7.4, before (blue contours) and after (red contours) incubation at 60°C for 10 min. Only resonances that corresponded to YscUCN were visible after the thermal treatment. (B) Thermal up- and down-scans of YscUC at pH 7.4 monitored with CD spectroscopy at 220 nm in the absence of calcium. (C) Thermal signatures of P264A, a non-cleavable mutant, at pH 7.4 in the absence of calcium. Up- and down scans of YscUC and P264A are shown in red and blue circles, respectively.

