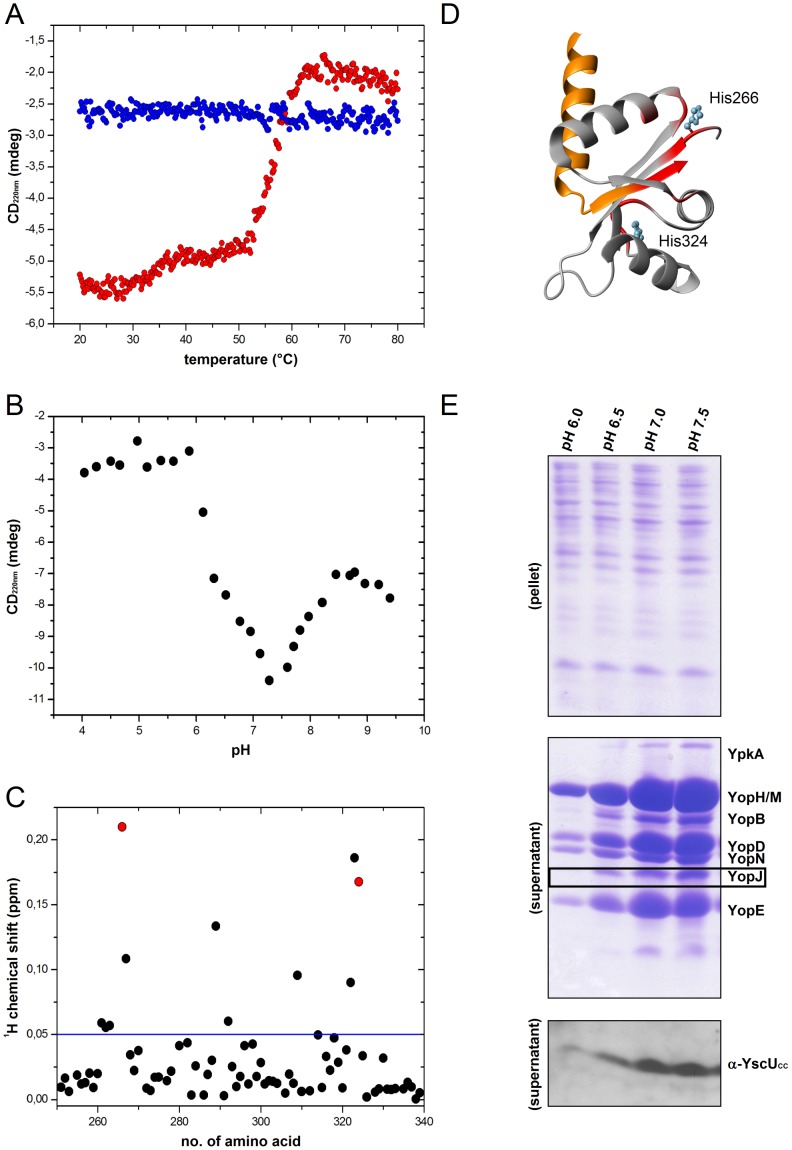
Figure 5. pH-dependencies of YscUC dissociation in vitro and Yop/YscUCC secretion in vivo.
(A) Thermal up- and down-scans of YscUC at pH 6.0, monitored with CD spectroscopy at 220 nm in the absence of calcium. The thermal signature of YscUC displayed one large-amplitude transition at 55°C. Up- and down scans of YscUC are shown in red and blue circles, respectively. (B) The pH-dependency of the YscUC monitored with CD spectroscopy at 220 nm. (C) Chemical shift perturbations of YscUC quantified from 1H-15N HSQC spectra, in response to a pH-shift from 7.4 to 6.0, displayed against the primary sequence. The blue line indicates the threshold value (0.05 ppm) used in Figure 5D. The chemical shift perturbation of the two histidines at positions 266 and 324 are shown in red. (D) Structural distributions of residues that show significant chemical shift perturbations in response to a pH-shift from 7.4 to 6.0 are shown in red on the YscUC structure (2JLI.PDB). The YscUCN and YscUCC fragments are colored orange and gray, respectively. The two histidine residues (266 and 324) in the folded part of YscUC are indicated. (E) Coomassie stained gels show Yop secretion under different pH conditions. (top panel) “pellet” indicates intracellular proteins; (middle panel) “supernatant” denotes secreted proteins. The YopJ protein (black box) was subjected to densitometric analysis for quantification of secretion levels (see Table 2). (bottom panel) The pH-dependency of YscUCC secretion was visualized on immunoblots with anti-YscUCC peptide antibodies.

