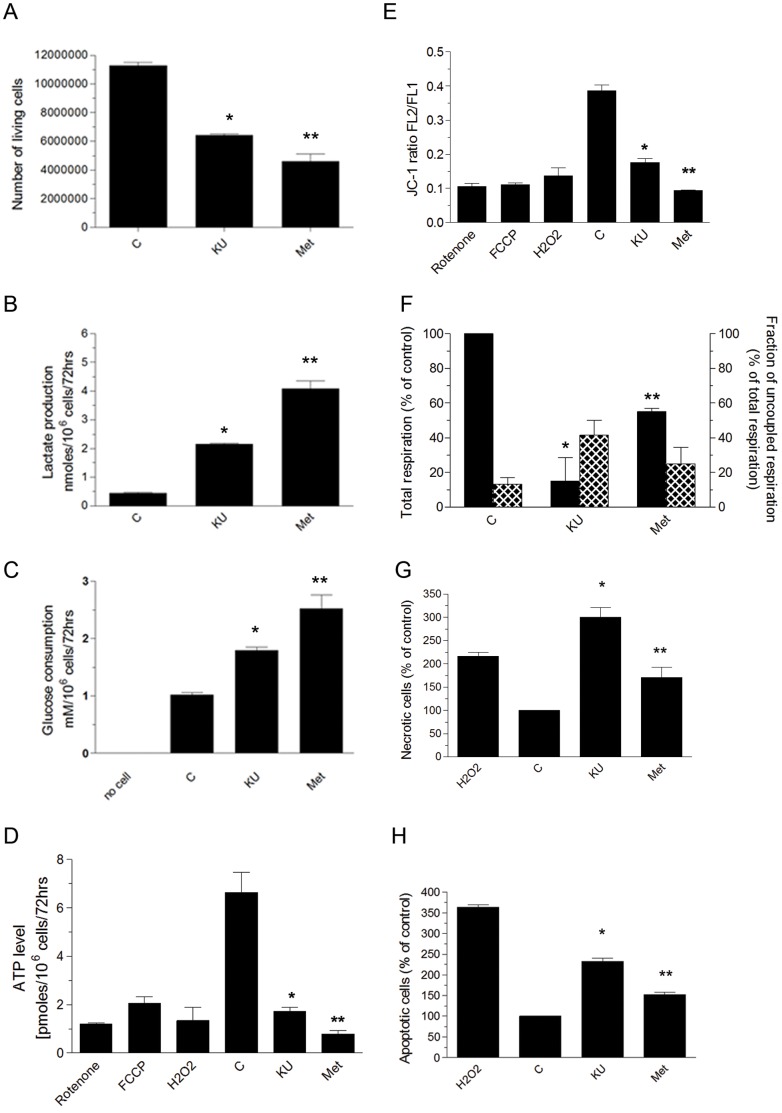
Figure 2. Effects of KU-55933 and metformin on metabolism in MCF-7 cells.
Cells were exposed to KU (10 µM) or metformin (5 mM) for 72 hrs. (A) The effect of KU-55933 or metformin on viable cell number was measured by counting cells able to exclude Trypan blue. Cell number was significantly reduced by KU-55933 (*P = 0.0042) and by metformin (**P = 0.0011). (B) Lactate production was significantly increased in cells treated with KU-55933 (*P = 0.0218) or metformin (**P = 0.0012). (C) Glucose consumption was increased with exposure to either KU-55933 (*P = 0.0463) or metformin (**P = 0.0058) treated cells. (D) Both KU-55933 and metformin decreased ATP levels in MCF-7 cells. Results are the mean ± S.E (n = 4). (KU-55933 compared to control *P = 0.0015 and metformin compared to control ** P = 0.0005). (E) Cells were incubated with JC-1 (2 µM), or H2O2 (100 µM, used to activate ATM by oxidative stress), or rotenone (1 µM), or FCCP (1 µM). Mitochondrial membrane potential was probed with JC-1 and visualized by flow cytometry. Loss of mitochondrial membrane potential (ΔΨ) is indicated by a decrease in FL2/FL1 fluorescence intensity ratio (see Figure S1 for flow cytometry data set). Results are expressed as mean ± S.E.M. (n = 4). KU-55933 (*P = 0.0003) and metformin (** P<0.0001) both significantly decreased ΔΨ. (F) Total cellular respiration (black bars, left y-axis) of MCF-7 cells treated with KU-55933 or metformin was compared with untreated cells. Results are the mean ± S.E.M. (KU-55933 compared to control *P = 0.0045, and metformin compared to control ** P = 0.0496). Uncoupled respiration was determined in the presence of oligomycin. The percentage of uncoupled respiration was calculated as: (uncoupled respiration/total mitochondrial respiration), and is shown by hatched bars, right y-axis. (G) KU-55933 or metformin treatment increased cell death (see Figure S2 for flow cytometry data set). Bars represent percentage of necrotic cells. Results are expressed as the mean ± S.E.M. (n = 3) in duplicate (KU-55933 compared to control *P = 0.0005, and metformin compared to control **P = 0.0299). (H) KU-55933 or metformin treatment resulted in increased apoptosis (see Figure S2 for flow cytometry data set). Bars represent percentage of apoptotic cells. Results are expressed as the mean ± S.E.M. (n = 3) in duplicate (KU-55933 compared to control *P<0.0001, and metformin compared to control **P = 0.0458).

